












 Compliance-first delivery
Engineering reliability, not hoping for it
Many teams have plenty of dashboards and still learn about outages from customers. Alerts fire on CPU spikes that do not matter, real problems hide between services, and every incident is investigated from scratch because nobody can follow a request across the system. Without agreed reliability targets, every conversation about “is it stable enough?” becomes a debate.
Our SRE engagements start with the user journeys that matter — sign-in, checkout, an HL7 feed, an API call — and turn them into service level indicators and objectives with error budgets. We instrument services with OpenTelemetry for traces, metrics and structured logs, build dashboards around those SLOs, and rewrite alerting so pages fire on symptoms users would notice. Incident response gets roles, runbooks and blameless postmortems. This sits naturally alongside CI/CD and DevOps automation (so you can see the impact of each deploy) and platform engineering (so new services are observable by default).
You finish with reliability as a number you can track, fewer and more meaningful alerts, and a team that knows how to run an incident. If you would rather not carry the pager yourselves, our managed services team can operate the monitoring and on-call rota 24/7.
- SLOs, SLIs and error-budget policy for key user journeys
- OpenTelemetry tracing, metrics and structured logging
- Symptom-based alerting that reduces pager noise
- Incident roles, runbooks and blameless postmortems
- Vendor-neutral: Prometheus/Grafana, Datadog, cloud-native tools

What's Included
Everything you need, delivered by a senior, security-first team.
SLOs & Error Budgets
Reliability targets tied to user journeys, with policies for when to slow down releases.
Distributed Tracing
OpenTelemetry instrumentation to follow a request across services, queues and databases.
Dashboards
SLO-centred views per service and journey instead of walls of unrelated graphs.
Alert Redesign
Audit and rewrite of alert rules so pages are actionable and routed to the right owner.
Incident Response
Severity levels, on-call rotas, incident roles and runbooks for common failure modes.
Postmortems
Blameless review templates and facilitation, with follow-up actions tracked to closure.
Reliability is engineered, measured and improved
Site Reliability Engineering (SRE) applies software-engineering practices to operations. Instead of chasing “100% uptime”, SRE defines how reliable a service needs to be for its users, measures it, and uses the gap between target and reality to make deliberate decisions about where to invest. Observability is what makes that possible: telemetry rich enough to answer new questions about your system without shipping new code.
When you need SRE and observability
- Users report outages before your monitoring does.
- On-call engineers receive dozens of alerts a night, most of them noise.
- Incidents take hours to diagnose because logs, metrics and traces live in different places.
- There is constant tension between shipping features and “stabilisation sprints”.
- You have moved to microservices or Kubernetes and lost the ability to follow a request end to end.
Monitoring vs observability
| Criteria | Traditional monitoring | Observability |
|---|---|---|
| Question answered | Is it up? Is CPU high? | Why is this request slow for these users? |
| Data | Predefined metrics and checks | Metrics, structured logs and distributed traces, correlated |
| Alerting | On causes (CPU, disk) | On user-facing symptoms (SLO burn rate) |
| Best for | Known failure modes | Unknown and emergent failures in distributed systems |
What we implement
SLIs, SLOs and error budgets
We identify the user journeys that matter (sign-in, checkout, API calls), define service level indicators such as success rate and latency, set objectives with your product owners, and agree an error-budget policy that says what happens when the budget is spent.
Instrumentation with OpenTelemetry
Vendor-neutral OpenTelemetry instrumentation for traces, metrics and logs, with consistent service names and attributes, so you can switch or combine back ends without re-instrumenting.
Dashboards and alerting
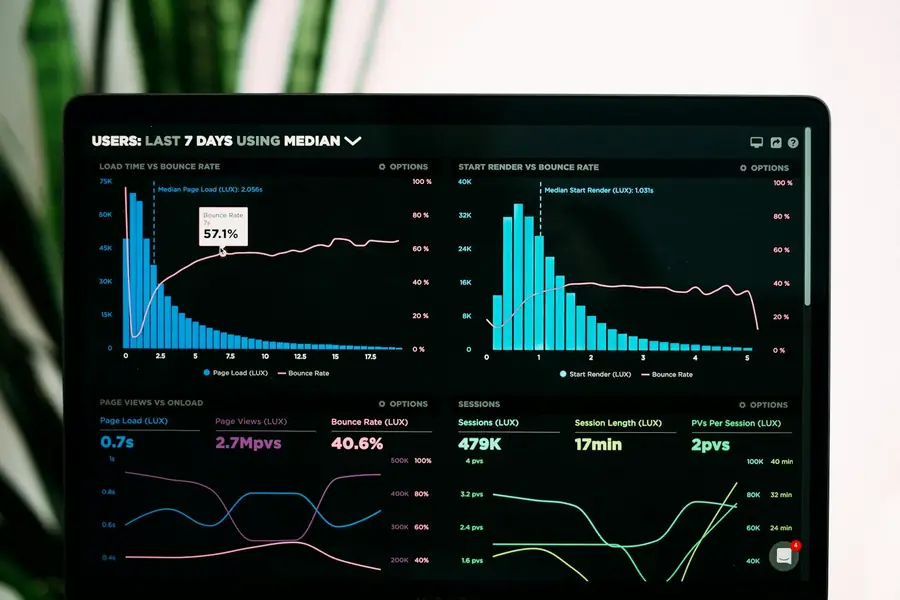
Service dashboards built around the four golden signals (latency, traffic, errors, saturation) and multi-window burn-rate alerts on SLOs, which page only when users are genuinely affected.
Incident management
Severity definitions, on-call rotations, runbooks, incident roles and communication templates, followed by blameless post-incident reviews with tracked actions.
Tools we work with
Prometheus, Grafana, Loki and Tempo; OpenTelemetry collectors; Elastic; Datadog, New Relic and Grafana Cloud; and cloud-native tools such as CloudWatch, Azure Monitor and Google Cloud Operations. We are pragmatic: the right stack depends on scale, budget and team skills, and telemetry volume can become a major cost if it is not sampled and retained sensibly.
Common pitfalls
- Setting SLOs at “five nines” without asking what users actually need.
- Alerting on every metric rather than on symptoms.
- Collecting every log line forever, then cutting retention after the bill arrives.
- Post-mortems that assign blame, so people stop reporting near-misses.
Deliverables
- SLO catalogue for critical services and an error-budget policy.
- Instrumentation, collectors and dashboards as code.
- Alert rules, routing and on-call setup.
- Incident response runbooks and a post-incident review template.
Related services
SRE works best on top of automated delivery — see DevOps automation and platform engineering. If you would rather we carry the pager, our managed cloud services include 24/7 monitoring and incident response. For Kubernetes-heavy estates, Kubernetes Without the Runaway Bill covers how to keep observability and compute costs in check, and our CloudMonitor product adds multi-cloud cost and inventory visibility.
How We Introduce SRE Practice
Baseline
Review current monitoring, alert volume and recent incidents; pick critical user journeys.
Define SLOs
Agree SLIs, objectives and error-budget policy with engineering and product.
Instrument
Add tracing, metrics and logs; build SLO dashboards and symptom-based alerts.
Practise
Run incident drills, establish postmortems and hand over runbooks and on-call.
Frequently Asked Questions
SRE is an engineering discipline that applies software practices to operations. It uses service level objectives, error budgets, automation and observability to run systems reliably and to balance reliability work against feature delivery.
An SLO is a measurable reliability target for a user-facing behaviour, for example 99.9% of checkout requests succeeding over 30 days. The error budget is the remaining 0.1%: while budget remains, teams ship; when it is spent, reliability work takes priority.
We work with OpenTelemetry, Prometheus, Grafana, Loki, Tempo, Elastic, Datadog, New Relic and cloud-native tooling such as CloudWatch and Azure Monitor. We usually extend what you already have rather than replacing it.
By alerting on user-facing symptoms through SLO burn-rate alerts, removing or downgrading cause-based alerts that do not need a human, routing alerts to the owning team and attaching runbooks to every page.
Usually as a fixed-price project to define SLOs, instrument critical services and set up alerting and incident processes, optionally followed by a monthly retainer or managed service for ongoing operations.
Book a free consultation. We pick one or two critical user journeys, review current telemetry and alerting, and propose a plan from there.
Ready to get started with SRE & Observability?
Book a free consultation — we'll map a secure, practical path forward.