













 Compliance-first delivery
A modern data stack that people actually use
Most organisations do not lack data; they lack agreement on it. Finance and sales report different revenue figures, dashboards break when a source system changes, analysts spend their week exporting CSVs, and leadership stops trusting the numbers. Buying another BI tool does not fix any of that.
We build the foundations first. Data from your applications, CRM, finance and marketing tools is loaded into a cloud warehouse or lakehouse, then transformed with version-controlled, tested models (typically SQL and dbt) into clean, documented tables. Core business metrics are defined once in a semantic layer so every dashboard uses the same definition of “active customer” or “revenue”. Data quality checks, freshness alerts and lineage make problems visible before they reach a board pack. Getting data out of operational systems reliably often overlaps with our systems and API integration work.
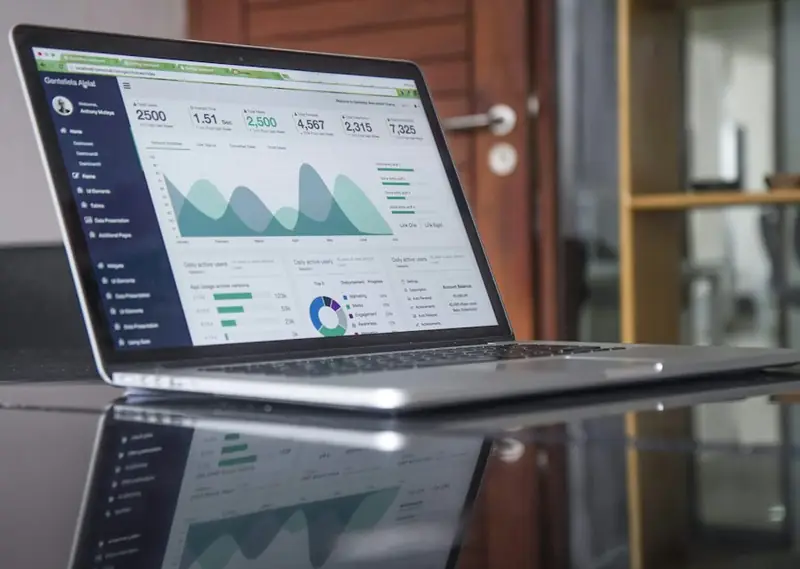
You end up with one governed source of truth, self-serve dashboards teams can explore without filing a request, and a platform ready for machine learning when you want it — our AI and data engineering team builds on the same warehouse. For marketing teams, website and lead data can flow in from tools such as Insight OS, and if cloud spend is the question, CloudMonitor answers it.
- Cloud data warehouse or lakehouse design
- Tested, version-controlled ELT pipelines
- Metrics defined once in a governed semantic layer
- Self-serve BI dashboards for each team
- Data quality checks, freshness alerts and lineage
What's Included
Everything you need, delivered by a senior, security-first team.
Warehouse & Lakehouse
Platform selection and design on BigQuery, Snowflake, Redshift, Synapse or Postgres.
ELT Pipelines
Managed and custom connectors with scheduling, retries and alerting.
Data Modelling
dbt-style models with tests, documentation and a shared metrics layer.
BI Dashboards
Dashboards in Power BI, Looker, Metabase or similar, designed around decisions.
Data Quality & Governance
Tests, ownership, access controls and lineage for sensitive data.
Reverse ETL & Activation
Push clean data back into CRM and operational tools where teams work.
Analytics people actually trust and use
Most organisations do not lack data; they lack data they trust. Finance, sales and operations each export from different systems, apply different definitions and arrive at different numbers. A modern analytics stack fixes this with a single, governed source of truth: data is loaded automatically into a cloud warehouse, modelled once with tested business definitions and served to dashboards and tools that people use every day.
When you need an analytics partner
- Monthly reporting takes days of spreadsheet work.
- Different teams quote different numbers for revenue, customers or churn.
- Dashboards exist but nobody trusts or opens them.
- Your operational database slows down whenever someone runs a report.
- You want to prepare data for machine learning or AI features.
The modern data stack
| Layer | Purpose | Common tools |
|---|---|---|
| Ingestion (EL) | Copy data from apps and databases on a schedule or in real time | Fivetran, Airbyte, Stitch, cloud-native connectors |
| Warehouse | Store and query analytics data at scale | BigQuery, Snowflake, Redshift, Databricks, PostgreSQL |
| Transformation (T) | Clean, join and model data with tested SQL | dbt |
| Semantic layer | Define metrics once (revenue, active users) | dbt Semantic Layer, Looker, Cube |
| BI and dashboards | Explore and share insights | Power BI, Looker, Metabase, Superset, Tableau |
| Activation | Send modelled data back to CRM and marketing tools | Reverse ETL tools, custom syncs |
ETL vs ELT
Traditional ETL transforms data before loading it, which made sense when storage and compute were expensive. Cloud warehouses make ELT — load raw data first, then transform inside the warehouse — simpler and more flexible: raw history is preserved, transformations are version-controlled SQL, and models can be rebuilt when definitions change.
Our approach
1. Start with decisions
We begin with the questions leaders need answered and the metrics that drive them, not with tools.
2. Build the foundation
Ingestion pipelines, a warehouse sized to your volume and budget, and dbt models with tests for freshness, uniqueness and accepted values. The heavier pipeline and ML work is handled by our AI and data engineering team.
3. Define metrics once
A metrics glossary agreed with business owners, implemented in a semantic layer so every dashboard uses the same definitions.
4. Dashboards that get used
A small number of focused dashboards per audience, with clear owners, rather than hundreds of unused reports.
5. Governance and cost
Role-based access, masking of personal data, documentation and warehouse cost monitoring. For data subject to HIPAA or GDPR, see HIPAA, GDPR and SOC 2 compliance.
Website and product analytics
For marketing and product teams, behavioural data matters as much as financial data. Our Insight OS product combines website analytics, live chat and lead capture in one lightweight script, and can feed your warehouse. For organic search reporting, see our SEO services.
Common pitfalls
- Buying a BI tool before cleaning and modelling the data.
- Untested transformations, so errors reach executive dashboards.
- Metric definitions hidden inside individual dashboards.
- Uncontrolled warehouse queries driving up cloud costs — see our FinOps playbook.
Deliverables
Ingestion pipelines, a modelled and tested warehouse, a metrics glossary, dashboards, documentation and training — all in your accounts and repositories. Connecting more source systems? Our systems and API integration team can help.
How We Build Your Data Platform
Discover
Identify the decisions, questions and metrics that matter, and the sources behind them.
Foundation
Stand up the warehouse, ingestion pipelines and first tested models.
Deliver Insight
Build the first dashboards with the teams who will use them, then iterate.
Scale & Govern
Add sources and domains, quality monitoring, access controls and training.
Frequently Asked Questions
It is a set of cloud tools that load data from your systems into a cloud warehouse, transform it with version-controlled SQL (usually dbt), define metrics consistently and serve them to BI dashboards and other tools.
It depends on your existing licences and users. Power BI suits Microsoft-centric organisations, Looker suits strong central metric governance, and Metabase or Superset are cost-effective open-source options. We recommend after understanding your needs.
A first set of trusted dashboards for one area, such as sales or finance, can often be delivered within a few weeks once data access is in place. Further areas are added in iterations.
Usually as a fixed-price foundation phase covering ingestion, warehouse, core models and first dashboards, followed by monthly support or further phases. Warehouse and tool subscriptions are billed to your own accounts.
Yes. We often improve an existing warehouse or BI setup — adding tests, fixing models and consolidating metrics — rather than starting again.
Book a free consultation. We discuss the decisions you need to support and the systems involved, then propose a first phase.
Ready to get started with Data & Analytics?
Book a free consultation — we'll map a secure, practical path forward.